OKR vs KPI: What to Keep Steady, What to Change
OKR vs KPI is not a contest: KPIs track health, OKRs drive change. The difference, KPI examples, and five steps to connect both, with a worked example.

Contents
- 01What a KPI is, and what it is not
- 02What OKRs are: five elements and three types
- 03OKR vs KPI: the difference in eight points
- 04What actually happens in Marcus’s studio: green numbers, no plan
- 05KPIs vs OKRs in practice: three ways they connect
- 06From KPIs to your first OKR in five steps
- 07Three mistakes that turn OKRs back into KPIs
- 08OKR and KPI in your personal life
- 09OKR vs KPI in the goal chain: from year to day
- 10Frequently asked questions about OKR vs KPI
OKR vs KPI is not a contest. A KPI, or key performance indicator, tracks whether something keeps working the way it should. An OKR, short for objectives and key results, sets what should change by a certain date and how you will know it did. The KPI watches the current state, the OKR plans the change. Anyone who asks which one to pick is asking the wrong question, because a team that wants to grow needs both.
The difference between OKR and KPI fits into two questions. A KPI asks “Is it working?” An OKR asks “What needs to be different?” This guide works it through with Marcus, 34, who owns a small personal training studio in Denver with two part-time coaches. He tracks eleven numbers every month and still has no plan for the next quarter. Along the way you get a side-by-side table, KPI examples for seven areas, five steps from your KPIs to a first OKR, and the one mistake almost every team makes on its first try.
What a KPI is, and what it is not
A KPI is a metric someone chose on purpose, because it shows whether an important part of the work is healthy. It has three fixed traits: a target range, an owner, and a regular rhythm of measurement. What it does not have is an end date. As long as the business runs, the KPI gets measured.
Every KPI is a metric, but not every metric is a KPI. A metric is any number you collect: page views, phone calls, miles run. It becomes a KPI only when it stands for a goal and someone acts the moment it leaves its range. Consultant David Parmenter draws that line sharply in his 2007 book “Key Performance Indicators” and offers a rule of thumb he calls 10/80/10: about ten key result indicators for the board, up to 80 result and performance indicators for the teams, and only about ten true KPIs. That means: the word key is a filter, not a label.
Marcus tracks eleven numbers, from monthly revenue to Instagram followers. Six of them actually steer the studio. Those are his KPIs. The other five are metrics he looks up when a KPI starts to drift.
KPI examples for seven areas
A KPI is only as good as the question behind it. Here are typical KPIs for seven areas, each with the question it answers:
- Sales: monthly revenue, close rate, average deal size. The question: Are we selling enough, and at what price?
- Marketing: cost per lead, website conversion rate, share of returning visitors. The question: Are the right people coming, and do they stay?
- Customer support: first response time, first contact resolution, customer satisfaction score. The question: Do customers get a fix fast?
- Finance: gross margin, months of cash runway, days sales outstanding. The question: Does the business pay for itself?
- People: employee turnover, absence rate, time to hire. The question: Do people stay healthy, and do they want to stay?
- Operations: on-time delivery, defect rate, cycle time. The question: Does the work arrive on time and without errors?
- Personal life: resting heart rate, average hours of sleep, savings rate. The question: Am I doing well, and is the money enough?
No team needs all of them. Five to seven KPIs per team are plenty, because nobody reads more than that on a Monday morning. Anyone who tracks 25 KPIs really tracks none, because no single number stands out anymore. The skill is in leaving numbers out, not in collecting them.
Metric, KPI, key result: three words, three jobs
A metric is any number you measure. A KPI is a chosen metric with a target range that shows, permanently, whether something is healthy. A key result is a number with a starting value, a target, and a date that shows whether a planned change worked. The same number can play all three roles, just never at the same time.
What OKRs are: five elements and three types
OKR stands for objectives and key results. The objective is a qualitative goal in one sentence that says where you want to go. Under it sit three to five key results, measurable outcomes with a starting value and a target, that tell you whether you got there. An OKR usually runs for one quarter. After that it gets scored and replaced.
Andy Grove built the method at Intel in the 1970s and described it in his 1983 book “High Output Management.” John Doerr brought it to Google in 1999 and wrote it up in “Measure What Matters” in 2018. There is no official list of parts, but most guides count five elements of an OKR:
- Objective: the direction, in words, without a number.
- Key results: three to five measurable outcomes, each with a start and a target.
- Initiatives: the projects and tasks you expect to move the key results.
- Cadence: a fixed cycle, usually a quarter, with a short check-in every week.
- Score: a grade at the end of the cycle, often from 0.0 to 1.0, followed by a short review.
Most guides also sort OKRs into three types. Committed OKRs are promises that have to land, like a launch date, and anything below 100 percent counts as a miss. Aspirational OKRs stretch past what feels safe, and Doerr describes Google treating about 70 percent as a success for them. Learning OKRs, a type many coaches add, test an assumption before a team commits real effort.
How to write, score, and run a full cycle is covered in the guide to the OKR framework. For this comparison one thought is enough. An OKR is a plan with a yardstick. A KPI is a gauge without a plan.
OKR vs KPI: the difference in eight points
Both use numbers, which is exactly why people mix them up. The difference is not in the number. It is in what you plan to do with it. These eight points keep OKRs and KPIs apart:
| Point | KPI | OKR |
|---|---|---|
| Core question | Is it working? | What needs to be different? |
| Time frame | ongoing, no end date | one cycle, usually a quarter |
| Direction | hold steady, stay in range | move from a starting value to a target |
| Structure | one number with a target range | one objective in words plus three to five key results |
| Success | the number sits in its range | around 70 percent counts as success on stretch goals |
| How many | five to seven per team | one to three objectives per team per quarter |
| When the number slips | find the cause and fix it | change the approach, keep the goal until quarter end |
| Where it lives | dashboard, monthly report | quarterly planning, weekly check-in |
Three of these points carry the whole difference. First, direction: a KPI is good when it stays where it belongs. A key result is good when it moves. Second, time: a KPI keeps running, an OKR ends. Anyone who never closes an OKR has a KPI with a fancier name.
Third, the definition of success. A KPI in range is done, and there is nothing more to win. A stretch OKR that hits 100 percent was, in Doerr’s account of Google, probably set too low. Committed OKRs are the exception. There, even Doerr expects the full 100 percent.
So what about numbers that show up on both sides? Marcus’s studio answers that in a moment. First, a picture that sticks. In short: the KPI is the dashboard, the OKR is the destination. The dashboard tells you the engine runs and the tank is full. It does not tell you where to drive.
What actually happens in Marcus’s studio: green numbers, no plan
Marcus coaches small groups and private clients, and his two part-time coaches cover the early mornings and the evenings. At the end of March he had 64 active clients paying an average of $340 a month. Here are his six KPIs at the end of the first quarter:
| KPI | Target range | End of March | Status |
|---|---|---|---|
| Active clients | 60 to 75 | 64 | green |
| Monthly revenue | at least $20,000 | $21,800 | green |
| Sessions per client per month | at least 6 | 6.1 | green |
| No-show rate | under 8 percent | 9 percent | yellow |
| Monthly client churn | under 6 percent | 11 percent | red |
| Share of cancellations in the first 90 days | no target | 58 percent | none |
Three numbers are green, one is yellow, one is red. The monthly report looks solid. Yet Marcus feels stuck, because every month he spends his ad budget and his evenings replacing clients who left. What does the dashboard tell him about that? Nothing. It shows that churn is red. It does not show him what to change.
This is the heart of OKR vs KPI. A KPI is built to notice, not to decide. Marcus’s first reflex is the usual one: run more ads. That is not a plan, it is a refill, and it treats a leak by pouring in more water. The row he almost skipped is the one without a status. Of all cancellations, 58 percent happen in a client’s first 90 days, before the habit sticks and before the first visible results.
At 11 percent churn, about seven of his 64 clients leave every month. Each one takes about $340 a month in revenue out the door. Whoever sees that number has already found the objective. That means: the best source for an OKR is rarely the red KPI itself. It is the metric that explains why the KPI is red.

KPIs vs OKRs in practice: three ways they connect
KPIs and OKRs do not run side by side, they interlock. There are exactly three relationships between them, and every number in your business sits in one of them.
A KPI becomes a key result
As soon as a KPI needs to change, it becomes a key result for one quarter. Marcus’s churn rate is a KPI all year. In the second quarter it gets a starting value, a target, and a date: from 11 to 6 percent by June 30. Now it is a key result. The number stays the same, only its job changes.
A KPI becomes a guardrail
Some numbers must not get worse while the OKR pushes somewhere else. Christina Wodtke calls them health metrics in “Radical Focus” and puts them next to the OKR in every weekly check-in. For Marcus, those are coach workload and monthly revenue. Anyone who chases retention by handing out free extra sessions will keep clients and burn out the coaches. The guardrail shows that before it gets expensive.
A key result becomes a KPI
Once a key result is reached, it does not just disappear. The new level is supposed to stay, so the number moves back to the dashboard with a new target range. If Marcus gets churn to 6 percent, it becomes a KPI from July with a range of under 7 percent. The next OKR can then go after something else.
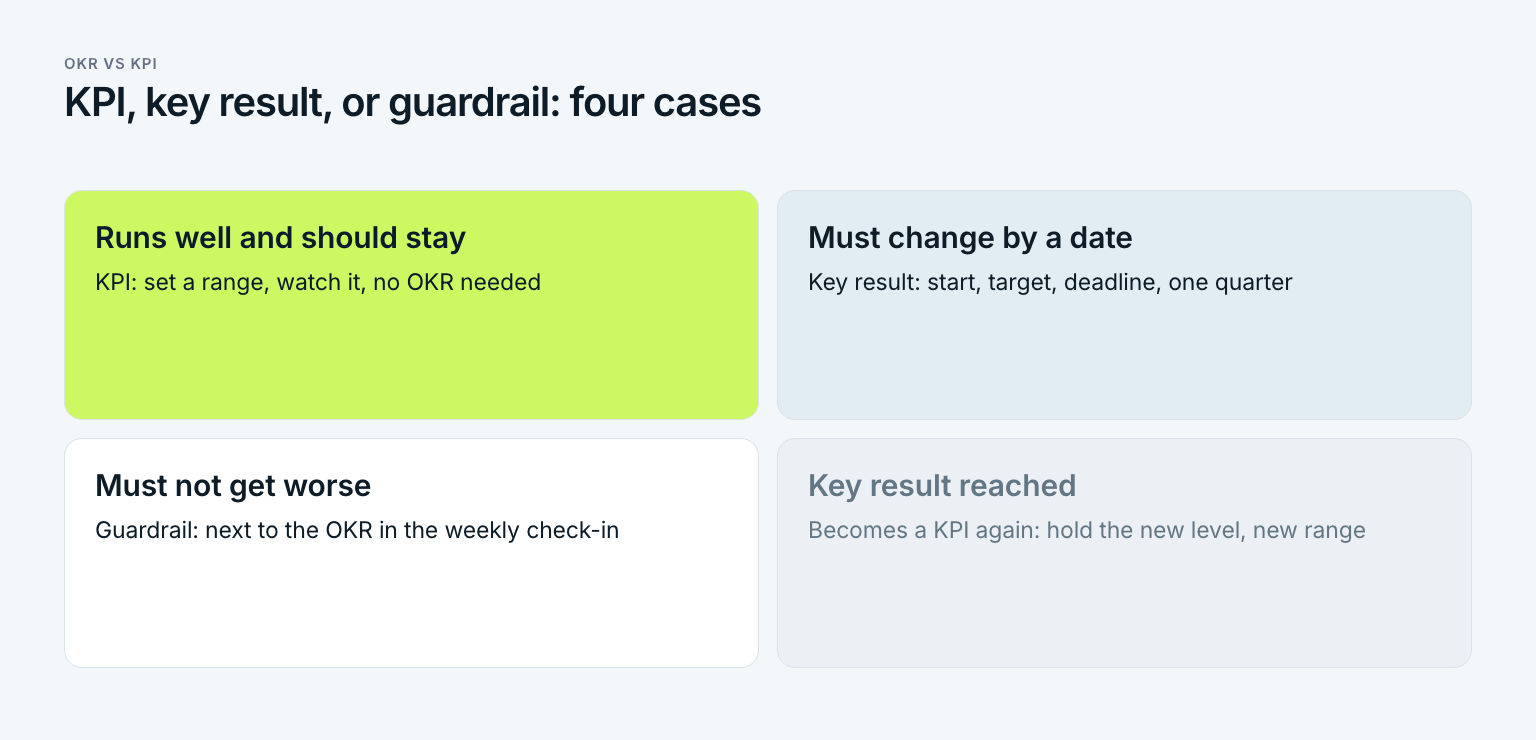
The grid doubles as a decision tool for every number you track. Should it stay, change, be protected, or has it already hit its goal? The answer tells you whether it belongs on the dashboard, in the OKR, or among the guardrails.
From KPIs to your first OKR in five steps
Most teams have KPIs long before they try OKRs. That is an advantage, because the data already exists. Here is how to turn a dashboard into a quarterly goal in one session of about 90 minutes:
Sort your metrics, 20 minutes
List every number your team tracks. Mark the five to seven where someone acts when they slip. Those are your KPIs, and the rest stay metrics. Marcus went from eleven to six.
Set the status, 15 minutes
Give every KPI a target range and a color for where it stands today. Then look for the metric that explains why a KPI is red or yellow. For Marcus, that is the share of cancellations in the first 90 days sitting behind the high churn.
Write one objective, 15 minutes
Write one sentence about what should be different by the end of the quarter, without a number. A good objective is clear to everyone on the team and takes a little nerve. Marcus wrote: “New clients are hooked before their first month is over.”
Derive the key results, 25 minutes
Three outcomes are usually enough, each with a starting value, a target, and a date. At least one should be a KPI that needs to move. Test each key result with one question: can you answer it with yes or no on June 30?
Set guardrails and a rhythm, 15 minutes
Pick two KPIs that must not get worse. Set a weekly check-in of 15 minutes where key results and guardrails sit side by side. Review the other KPIs in the monthly report as before.
Step four is where most drafts fail, because the key results come out too soft. A good key result passes the same test as a good SMART goal, and you can borrow phrasing from these SMART goals examples. Anyone who writes “improve” or “optimize” at this point gets no answer at the end of the quarter, only a debate.
Marcus’s OKR for the second quarter
The result of the session fits on one page. The objective: new clients are hooked before their first month is over. Under it sit three key results and two guardrails, shown here after week 7 of 13:
| Key result | Start | Target by June 30 | Week 7 |
|---|---|---|---|
| Monthly client churn | 11 percent | 6 percent | 8.5 percent |
| New clients who book eight sessions in their first 30 days | 35 percent | 60 percent | 47 percent |
| Cancellations in the first month | four a month | one a month | 2.5 a month |
| Guardrail: sessions per coach per week | 28 | 32 at most | 30 |
| Guardrail: monthly revenue | $21,800 | at least $20,000 | $22,300 |
After week 7 of 13, 54 percent of the quarter is gone. All three key results sit at about half their way: churn has dropped 2.5 of 5 points, the 30-day booking rate has climbed 12 of 25 points, and first-month cancellations are down 1.5 of 3. Progress runs slightly behind time, so Marcus adjusts his weekly goals, not the objective. The guardrails hold. This is where OKRs and KPIs together say more than either does alone: the studio moves the right thing without breaking anything else.
What the studio actually does is not in the key results. It is in the initiatives: a 12-week goal written with every new client in the first session, a check-in text from the coach after week two, and a strength test with a progress photo on day 30. The 12-week goal follows the same logic as coaching goals for new clients: one end state, one date, owned by the client. Initiatives are tasks, key results are effects. Anyone who mixes them up checks off 40 welcome texts and still does not know whether a single client stayed. For a blank structure to fill in, use the OKR template.
Three mistakes that turn OKRs back into KPIs
Running KPIs well is good work, and no team should drop them just because it starts using OKRs. The mistakes happen at the seam between the two. Each one feels reasonable at the time. Which one is happening to you right now?
The most common mistake: renaming your dashboard as OKRs
On the first try, many teams take their KPIs, write an objective on top, and call the result an OKR. They end up with twelve key results that all start with “maintain” or “keep.” A key result that is already met on the first day of the quarter is a KPI with a new name. That means: every key result needs a gap between its start and its target, or it belongs on the dashboard. Three to five per objective are plenty, and Christina Wodtke argues in “Radical Focus” for a single objective per team.
- OKRs without guardrails. A studio that only watches churn will start giving away free sessions to keep people, and coach hours explode. Revenue per client drops, and nobody notices because it never comes up in a check-in. Two guardrails per OKR prevent that, and they take one minute in the weekly check-in.
- OKRs tied to bonuses. Doerr argues in “Measure What Matters” that OKRs and compensation should be kept apart. Whoever gets paid for hitting a target sets safe targets, and the stretch OKR turns into a KPI with a bonus attached. KPIs and conversations are better inputs for reviews, while OKRs stay a tool for focus.
All three mistakes have one thing in common. They push the OKR back into the role of the KPI, the number that only watches. Without a gap between start and target, without guardrails, and without room to miss, what is left of the OKR is a second monthly report.
OKR and KPI in your personal life
The difference works outside the office too. In your own life there are numbers that should simply keep running and goals that should change something. Marcus tracks three personal KPIs: resting heart rate, average hours of sleep, and his savings rate. He looks at them once a week and does nothing as long as all three are in range.
His personal OKR for the second quarter looks different. The objective: no debt except the mortgage by the end of June. The key results: credit card balance from $3,900 to zero, emergency fund from one to two months of expenses, eating out from $600 to $250 a month. The guardrail is a KPI he already tracks, retirement savings at 6 percent of income. Anyone who clears the card by pausing retirement savings has only moved the problem to a later decade.
In short: in your personal life the difference is even easier to see. Nobody sets a quarterly goal to keep their resting heart rate where it is. And once the card is paid off, its balance turns into a KPI again. It should stay at zero, and nobody needs a quarterly plan for that.
OKR vs KPI in the goal chain: from year to day
An OKR describes a quarter. A KPI describes a state. What both are missing is the link to today, because neither a key result nor a dashboard tells you what to do on Tuesday morning. A goal chain closes that gap. Every smaller goal hangs from a bigger one: year, quarter, month, week, day.
For Marcus, the chain looks like this. The yearly goal: the studio grows to 80 clients without a third coach. The quarterly goal is his OKR with its three key results. The monthly goal for April is the first stage of it: churn from 11 to 9.5 percent and a 12-week goal written with every new client. The weekly goal: build the day-30 check-in and walk both coaches through it. The daily goal for Tuesday: draft the 12-week goal sheet, 60 minutes before the first class.
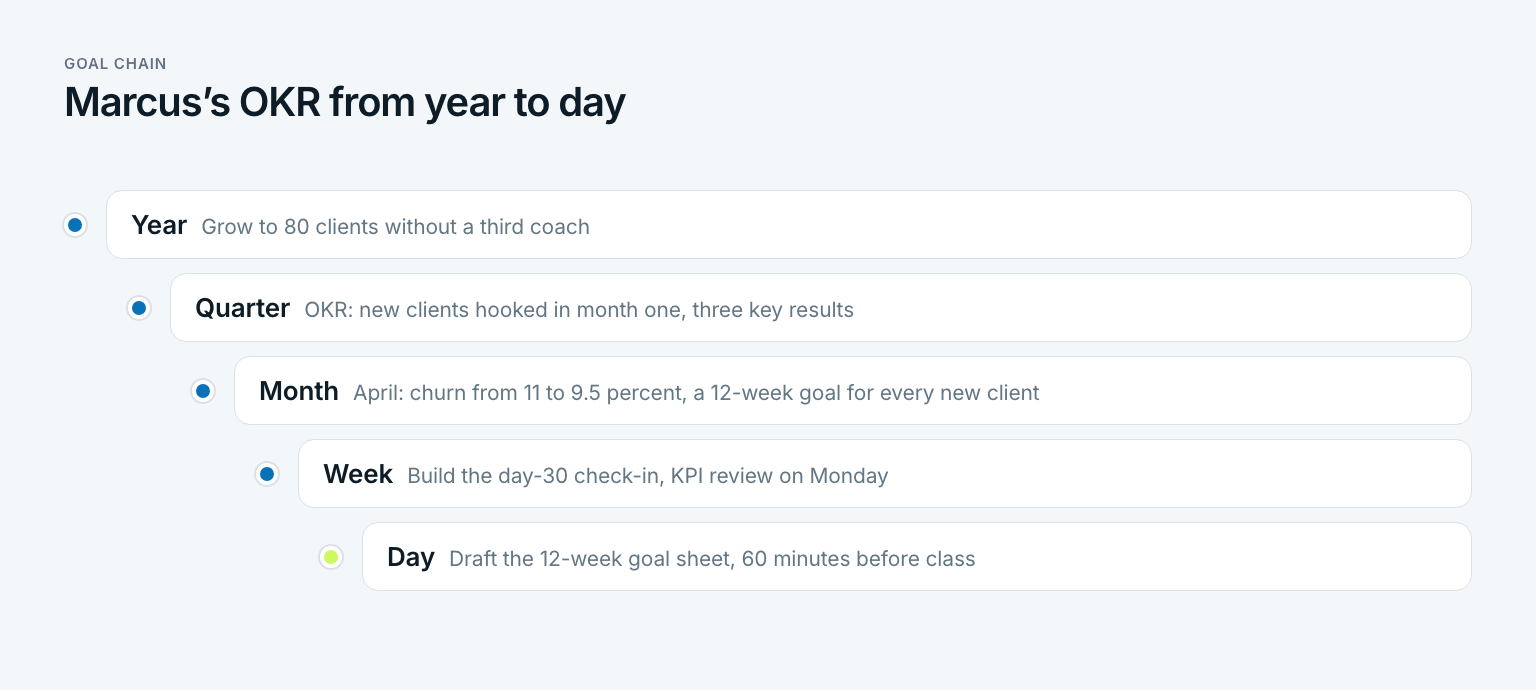
KPIs have a fixed spot in this chain, and that spot is the week. In the Monday check-in, key results and guardrails sit side by side, and Marcus decides whether the weekly goals still make sense. Progress in the quarter is the share of the distance covered, with elapsed time as a second line next to it. When progress falls behind time, he changes the weekly goals, not the objective.
In Gaapp, this chain is the core: year, quarter, month, week, and day, with every goal attached to a bigger one. You set up an OKR as a quarterly goal under a yearly goal, with the key results as monthly goals below it and the start and target values in the title. You check goals off at every level, and a thin line shows how much of the period has already passed. What else OKR software should do is covered on the OKR software page.
Three questions to close, aimed at your own dashboard:
- Can you say, for every number on it, whether it should stay, change, or be protected?
- Does every one of your key results have a gap between its start and its target?
- Do you know which two KPIs must not get worse while your OKR runs?
Anyone who answers no to one of these does not have too few numbers, but too little clarity about what each number is for. In short: a KPI tells you where you stand, an OKR tells you where you are going.
Frequently asked questions about OKR vs KPI
What are examples of OKRs?
A studio owner might set the objective “New clients are hooked before their first month is over,” with key results like churn from 11 to 6 percent and first-month cancellations from four to one a month. A support team might aim for “Customers find answers before they write to us,” measured by fewer shipping questions and faster replies. A personal OKR works the same way, for example “No debt except the mortgage by June,” with the card balance and the emergency fund as key results.
What are the 5 elements of OKR?
There is no official list, but most guides name five: the objective, three to five key results, the initiatives that move them, a fixed cycle with weekly check-ins, and a score at the end. The objective sets the direction in words. The key results make it measurable, and the score turns the cycle into a lesson for the next one.
What are top 3 KPIs?
There is no universal top three, because a KPI is only key for a specific goal. For most small businesses, revenue, profit margin, and customer retention come first. For a team inside a company, pick the three numbers that show whether your part of the work is healthy.
What are the three types of OKRs?
Most guides name committed, aspirational, and learning OKRs. Committed OKRs must be met in full, aspirational OKRs stretch beyond what feels safe and count as a success at around 70 percent, and learning OKRs test an assumption before you commit real effort. Google’s own guidance works with the first two.
What is the difference between OKR and KPI?
A KPI measures whether something keeps working and has no end date. An OKR sets what should change by a certain date, usually within a quarter, and measures it with key results. A KPI becomes a key result when it needs to move, and a key result that was reached becomes a KPI again.
Do you need OKRs if you already have KPIs?
KPIs tell you whether something is working, not what to change. If all your KPIs are in range and you do not want anything to be different, you do not need an OKR. The moment you want to move something, such as churn or a new revenue line, an OKR gives you direction and a yardstick for one quarter.
Last updated: 19 October 2026
Read next
 Leadership & Teams
Leadership Styles: Which One Fits Which Situation
Leadership styles are not personality types: 11 types compared, Lewin, Goleman, situational leadership and five steps to find the style that fits you.
14 min read
 Leadership & Teams
Retrospective: How Teams Learn From Every Sprint
A retrospective is not a blame session: what the word means, five phases, seven retrospective examples and action items that stick, shown on one team.
16 min read
 Leadership & Teams
How to Delegate Tasks: Hand Off Work, Keep Results
Delegation is not dumping work: five levels of delegation, seven steps, a handoff script and what to keep, shown on one marketing team.
15 min read