Visualize Goals: See the Path, Not Just the Finish
Learning to visualize goals is not wishful thinking. Picture the process, test obstacles with WOOP and make progress visible, with a worked example.

Contents
- 01What it means to visualize goals, and what it does not
- 02Three types of goals and the picture each one needs
- 03Process or outcome: which goal visualization works
- 04Mental contrasting: the WOOP method
- 05How to visualize your goals in five steps
- 06Make progress visible: why a chart pulls you forward
- 07Visualize goals across the chain: year, quarter, month, week, day
- 08Three visualization mistakes nobody notices
- 09Three questions to ask before you visualize your goal again
- 10Frequently asked questions about goal visualization
Learning to visualize goals is not wishful thinking. To visualize goals means to picture the path to a goal so precisely, and to make it so visible, that the next action follows on its own: the routine, the obstacle, the progress so far. Anyone who only pictures the finish line feels better and often does less. Anyone who pictures the path knows what happens on Tuesday at 7 p.m.
Three techniques carry goal visualization: process visualization, mental contrasting as developed by psychologist Gabriele Oettingen, and a progress chart you walk past every day. Everything below is worked through with Priya, 34, a UX researcher at a health insurer in Columbus, Ohio, who has been asked to give a 20-minute talk at a regional design conference in March 2027 and who freezes whenever more than five people look at her. You also get five steps to copy, six formats for showing progress, and a translation into year, quarter, month, week and day.
What it means to visualize goals, and what it does not
Visualization means making something visible that does not exist yet, either in your mind or on paper. With goals, it takes two forms. The inner form is mental imagery: you run through a situation in your head before it happens. The outer form is a display: a bar, a poster of boxes, a chain of X marks on a calendar. Both serve the same purpose. They turn a distant goal into an action that is due today.
What visualization is not: a mechanism that makes wishes come true because you think about them often enough. That idea has had a large following since Rhonda Byrne's book "The Secret" in 2006, usually under the name law of attraction. It is easy to see the appeal, because a clear picture of a goal gives you direction and confidence. As a cause of results, it does not hold up. The goal does not come to you because you imagine it. You get to the goal because the imagery changes what you do, and it only does that under certain conditions.
What the research on visualization actually shows
Gabriele Oettingen, a psychology professor at New York University and the University of Hamburg, has studied those conditions for more than two decades. In a study with university graduates, published in 2002 with Doris Mayer, the graduates who fantasized most positively about landing a job had received fewer offers two years later and were earning less. In a 2011 experiment with Heather Barry Kappes, positive fantasies about the future lowered participants' systolic blood pressure, a marker of energy. The brain enjoys the goal in advance. The tension that drives action fades.
That is not a case against imagery. It is a case against imagery without a path. Positive fantasy feels like progress, and that is exactly the problem. Whoever pictures the win every night has already collected the good feeling before doing any of the work. That means: visualization helps when it shows the path, names the obstacles and makes progress measurable. Everything else is a daydream with good lighting.
Three types of goals and the picture each one needs
Sport psychology separates goals into three types. Each one needs a different kind of picture. Anyone who mixes them up ends up visualizing the wrong end of the problem.
- Outcome goal. The result at the end, often measured against other people or a benchmark: a strong talk, a promotion, a place on next year's lineup. You only partly control it. The fitting picture is the moment of arrival, and you rarely need it.
- Performance goal. A number that depends only on you: a talk that runs under 20 minutes, three filler words per minute or fewer, twelve full run-throughs. The fitting picture is a chart that shows where you stand.
- Process goal. The behavior that produces the performance: rehearse out loud twice a week, record every session, start each rehearsal by speaking, not by editing slides. The fitting picture is the routine itself, played through step by step in your head.
Priya's outcome goal is set: a 20-minute talk on Thursday, March 11, 2027, delivered without reading from notes. Her performance goals follow from it. Her first recording runs 27 minutes and contains nine filler words per minute. By March she wants under 20 minutes and three or fewer. Her process goals are small: Tuesday and Thursday at 7 p.m., 30 minutes, phone recording on. Whoever sorts goals this way sees at once where each picture belongs. The outcome gets a moment each quarter. The performance gets a chart. The process gets three minutes before every rehearsal.
Process or outcome: which goal visualization works
Most advice starts with the outcome: close your eyes and picture yourself on stage to applause. It is a pleasant exercise. It is just built for something other than next week's rehearsal. An outcome picture answers the question of why you want something. A process picture answers the question of what you do next. Which of those questions will you be facing on Tuesday at 7 p.m.?
Lien Pham and Shelley Taylor tested the difference in 1999 with UCLA students preparing for a midterm exam. One group spent a few minutes a day picturing the high grade. A second group pictured themselves studying: where they sat, which chapters they reviewed, how they put distractions away. The process group started earlier, studied more and earned better grades. The outcome group did no better than a control group that did no exercise at all.
In sports, the same idea goes by the name mental practice. A meta-analysis of 35 studies by James Driskell, Carolyn Copper and Aidan Moran in 1994 found that rehearsing a movement in your head improves performance. Physical practice works better, and the effect fades without a refresher. In short: imagery does not replace practice. It prepares it.
| Feature | Outcome visualization | Process visualization |
|---|---|---|
| Guiding question | How will it feel when I have done it? | What do I do step by step, and where does it get hard? |
| What Priya pictures | Applause, a line of people at the front afterward, her manager in the third row | Walking up at 2:40 p.m., the clicker in her hand, the first sentence, the blank moment in section three |
| Effect | Direction and anticipation | Readiness for specific situations, more action |
| Risk | The brain enjoys the win early and tension drops | Low, as long as it stays a rehearsal and does not turn into rumination |
| How often | Once when you set the goal, then at the start of each quarter | Before every key session, three minutes |
Priya tried it the other way first. For three weeks in September she watched conference talks at night and imagined herself getting the same applause. It felt great every time. She rehearsed out loud exactly once in those three weeks. The rest of the time she opened the slide deck, changed fonts and closed it again. More imagery did not lead to more rehearsal. If anything, it led to less.
The most common mistake: picturing the finish instead of the path
Anyone who imagines success every evening spends the anticipation before the work begins. The outcome picture belongs at the start, once, as the answer to why. After that, you visualize the routine and the hardest moment inside it. The goal stays in view, but it no longer pulls all of your attention toward itself.
First person or third person
There is a second dial: the camera angle. You can see a scene through your own eyes or from the outside, as if someone were filming you. Before the 2004 US presidential election, Lisa Libby and colleagues asked eligible voters to picture themselves voting. Those who pictured it from an outside view were more likely to actually vote. The researchers' explanation: the outside view shows you as the kind of person who does this. For Priya, that means rehearsing the walk to the stage through her own eyes, step by step. The picture of herself as someone who explains research to a full room, she sees from the back row.
Mental contrasting: the WOOP method
Mental contrasting is Oettingen's answer to her own findings. You first picture the outcome and immediately afterward the thing inside you that stands in the way. The contrast between the two creates the tension that leads to action. Oettingen combined the method with the if-then plans of psychologist Peter Gollwitzer and named it WOOP, after its four steps:
- Wish. A goal that challenges you and that you believe you can reach, in a few words.
- Outcome. The best outcome you can imagine, for about a minute, with images and feeling.
- Obstacle. The main obstacle inside you: a habit, an emotion, an excuse. Not the weather, not your boss.
- Plan. One sentence in the form: if the obstacle shows up, then I will do this.
The if-then part has strong evidence behind it. In 2006, Peter Gollwitzer and Paschal Sheeran reviewed 94 studies of these plans, which researchers call implementation intentions, and found a medium to large effect on reaching goals. The reason is simple. The plan takes the decision away from you in the hard moment, because the situation itself becomes the trigger. Whoever still has to weigh options at 7 p.m. on a tired Tuesday loses to the couch.
Two details decide whether WOOP works. The first is the order. People who think about the obstacle first and the outcome second do not get the same effect in Oettingen's studies. The second is expectation. Mental contrasting raises effort only for goals you believe are within reach. For a goal you do not believe in, it helps you let go. That is a result too, and it saves you months.
Here is Priya's WOOP:
| Step | Priya's answer |
|---|---|
| Wish | Give a 20-minute talk on March 11, 2027, without reading from notes |
| Outcome | The room laughs at her opening story, and she feels for the first time that she can explain her work, not just do it |
| Obstacle | When I sit down to rehearse, I start polishing slides instead of speaking, because hearing my own voice feels awkward |
| Plan | If I open the slide deck at 7 p.m., then I press record first and speak through section one before I touch a single slide |
Notice what is missing from the obstacle: no busy calendar, no fear of the audience in general, no complaint about the conference schedule. Those are outside conditions, and they have their own fixes. The inner obstacle is a two-minute negotiation with herself, disguised as productive slide work. That is where the plan aims. Anyone who looks for the obstacle outside finds reasons. Anyone who looks inside finds a lever.
How to visualize your goals in five steps
How do you visualize goals the right way? With a little outcome, a lot of process and a chart you cannot miss. The five steps take about 20 minutes the first time. After that, you need three minutes before each key session and five minutes a week.
Write the goal as one sentence with a number and a date, five minutes
Without a number there is nothing to see. Priya writes: a 20-minute talk on March 11, 2027, no notes. She adds two performance goals as checkpoints: a full run-through under 22 minutes by December 31 and three or fewer filler words per minute by March 1. A sentence without a date stays a wish, however good the picture next to it looks.
Picture the outcome once, two minutes
Close your eyes for a minute and run the best ending in detail: sounds, light, who is there. Then write down three keywords. Priya notes: laughter at the opening, people at the front, I can explain it. That is your why. You bring it back at the start of each quarter, not every evening.
Name the inner obstacle and write an if-then plan, five minutes
Ask yourself what inside you is stopping you. Take the first obstacle that feels true, not the one that sounds best. Write the plan as an if-then sentence and decide where it lives. Priya puts hers on a sticky note on the laptop lid, because that is where the hard moment happens.
Run the routine in your head, three minutes before each key session
Walk through the next session in your mind: time, place, first move, the moment it gets hard and what you do then. Before Thursday's run-through, Priya sees it: laptop open at 7 p.m., record on, section one standing up, the blank moment in section three. Then: pause, look at the next slide title, one breath, say "Here is what we found."
Make progress visible and update it weekly, five minutes
Put a chart where you pass it every day and update it once a week. Priya uses a whiteboard next to her monitor with 40 boxes, one per rehearsal session until March, and a second line for filler words per minute from each recording. Every Sunday she fills in the week. She sees how far she has come and whether the pace will hold until March.
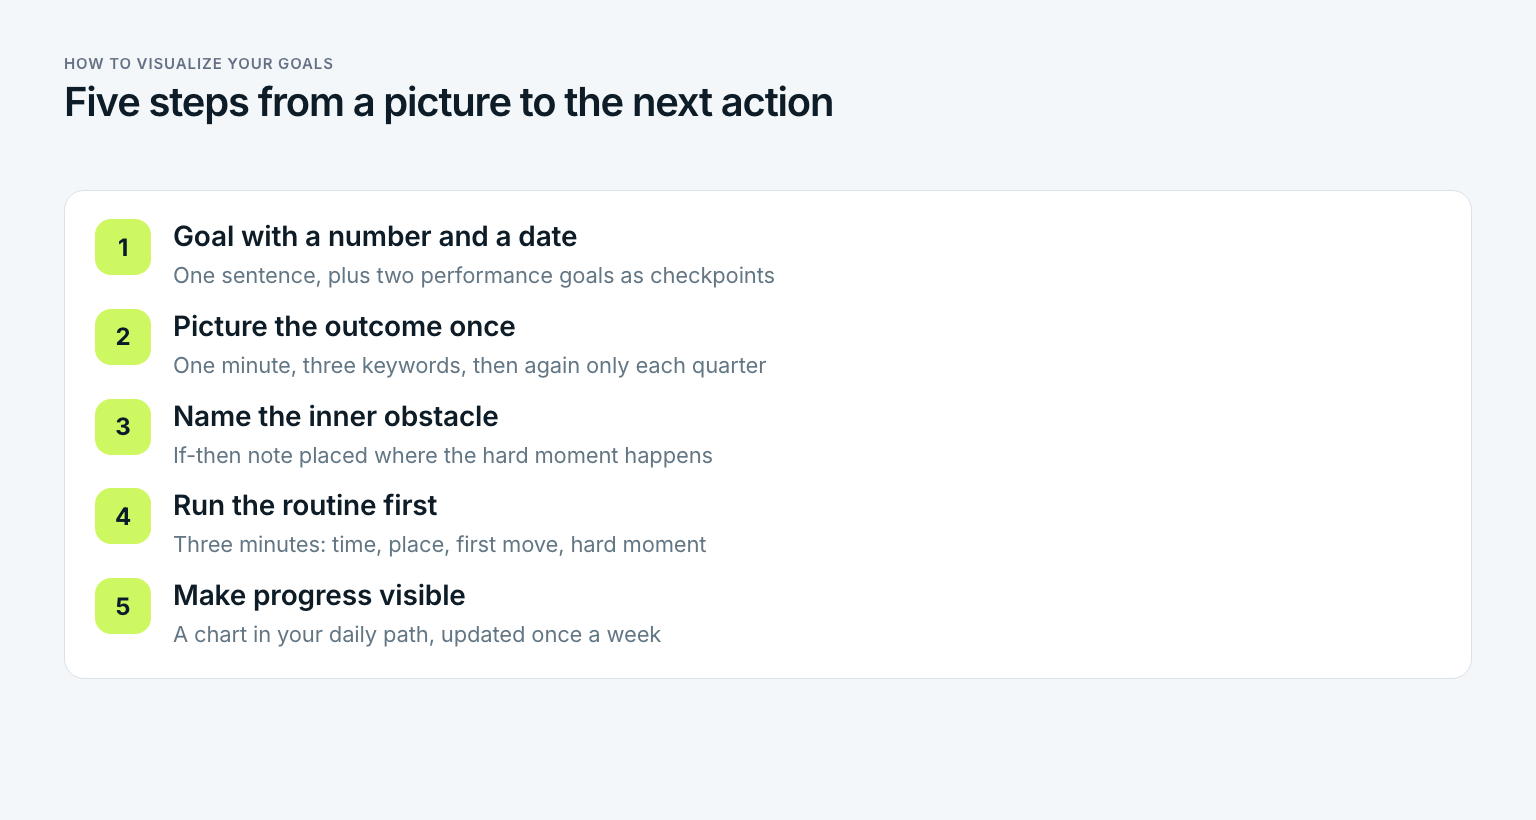
The fourth step is the one most people skip because it is unglamorous. Three minutes of routine does not feel like motivation. It feels like preparation. That is exactly why it works. When Priya's mind goes blank in section three on a Thursday night, she has already lived that moment once and knows what to do. Her head no longer has to negotiate.
Make progress visible: why a chart pulls you forward
The third technique needs no imagination at all. It shows what has already happened. That sounds trivial, and it is the part many guides on goal visualization leave out. Yet it has some of the best evidence behind it.
In 1932, Clark Hull observed that rats in a maze ran faster the closer they got to the food. In 2006, Ran Kivetz, Oleg Urminsky and Yuhuang Zheng showed the same effect in people at a university cafe. Customers received either a loyalty card with ten stamp spaces or a card with twelve spaces where two stamps were already filled in. Either way, they needed ten more coffees for the reward. The card with the head start filled up faster. A visible beginning pulls you forward.
Teresa Amabile and Steven Kramer analyzed about 12,000 diary entries from 238 knowledge workers for their 2011 book "The Progress Principle." The strongest driver of a good workday was the sense of making progress on meaningful work, even in small steps. Anyone who sees their progress keeps going. Anyone who cannot see it tends to underestimate it, and that drains motivation. When did you last see, at a glance, how far you have come on your most important goal?
The goal-gradient effect
The goal-gradient effect describes how effort increases as a goal gets closer. It only works if you can see the closeness. A goal without a chart feels just as far away in February as it did in October. That is why every visualization meant to last more than a few weeks needs a progress display.
For Priya, that has a practical consequence. Her whiteboard has 40 boxes, but she already rehearsed twice in the first week of October. She fills those two in on day one. That is not a trick. It is her real starting point, and it is exactly the head start the twelve-space loyalty card had.
Goal visualization examples: six formats compared
What are good examples of goal visualization in everyday life? Six formats have proven themselves for showing progress. Each one is built for a different kind of goal, and none does everything.
| Format | What it shows | Best for | Limit |
|---|---|---|---|
| Progress bar | Share of the distance from start to target | Performance goals with a number: miles, dollars, pages | On its own, it does not show whether you are on schedule |
| Box poster | One box per unit, filled in when done | Goals that split into equal pieces, also with kids | Gets hard to read beyond about 100 boxes |
| Calendar chain | An X for every day you did it | Process goals and habits | Measures consistency, not performance |
| Thermometer | Fill level up to the target line | Savings and fundraising goals | One number, no checkpoints |
| Milestone path | Stations along the way, each with a date | Outcome goals with clear stages, such as a move or a degree | Shows stations, not the work in between |
| Marble jar | One marble per finished unit, moved from one jar to another | Couples and families with a shared goal | Without marks on the jar, hard to read how much is left |
The calendar chain is often credited to comedian Jerry Seinfeld: an X every day, and do not break the chain. At its core it is a habit tracker. How to build one that feeds a goal is covered in the guide to the habit tracker. How to calculate your progress as a percentage and set it against elapsed time is in the article on achieving goals. This section is only about the picture. It has to hang where you pass it every day, and you have to be able to read it in ten seconds.
Vision board, goal image or progress chart: what each is built for
Three tools often get lumped together under goal visualization. None of them is wrong. Each one answers a different question.
- Vision board. A collage covering several areas of life, usually for a year or longer. It answers the question of where you want to go at all. How to build one that turns into a plan is covered in detail in the guide to the vision board.
- Goal image. A single image or sentence for a single goal, such as three keywords on a sticky note. It reminds you of the why. It says nothing about the path.
- Progress chart. A bar, a poster, a chain. It answers the question of where you stand right now and whether your pace is enough.
Whoever has only a vision board knows where they are headed but not whether they are moving. Whoever has only a progress chart moves forward but can easily lose the why by February. Priya needs only a little of each: the sticky note with three keywords on her laptop lid and the whiteboard next to her monitor. The rest is done by process visualization in her head, three minutes before each session.
Visualize goals across the chain: year, quarter, month, week, day
Each level of the goal chain needs a different form of visualization. The outcome sits at the top, the routine at the bottom and the chart in between. Anyone who flips that pictures the applause every morning and still does not know what Tuesday is for. How the levels connect in general is laid out in the guide on how to achieve goals.
| Level | Priya's goal | Visualization | When |
|---|---|---|---|
| Year | A 20-minute talk on March 11, 2027, no notes | Outcome picture and WOOP, three keywords on the laptop lid | Once in October, then at the start of each quarter |
| Quarter | Full run-through under 22 minutes by December 31 | Milestone path with three timed run-throughs at the end of October, November and December | After each timed run-through |
| Month | October: outline done, section one recorded, eight sessions | Box poster on the whiteboard, eight boxes for October | Every Sunday evening |
| Week | Two sessions, Tuesday and Thursday, one recording each | Two fixed slots, routine run-through the night before | Sunday evening, five minutes |
| Day | Tuesday 7 p.m., section one twice, count filler words | If-then note on the laptop, record first, 60-second routine | Right before the session |
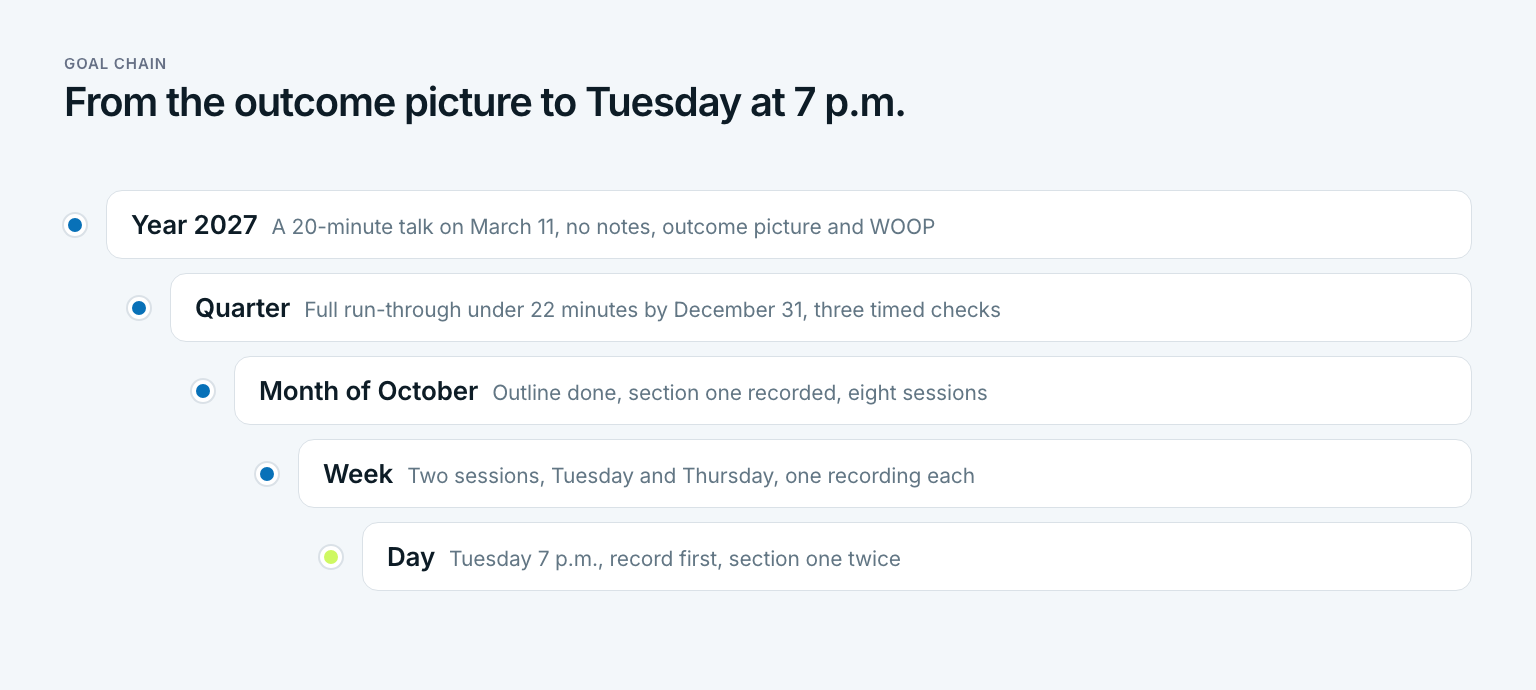
The table shows why the goal chain and visualization belong together. The outcome picture appears only at the top, four times a year. The chart gets updated every week. The routine runs for a minute before every session. That means: the closer the level is to today, the shorter and more concrete the picture becomes.
If you keep all five levels in Gaapp, you see the progress bar of each level next to the time that has passed, without drawing anything yourself. Priya keeps the whiteboard anyway. The whiteboard is for the daily glance, and the bar in the app answers the question of whether her pace will get her to March.
Three visualization mistakes nobody notices
Visualization rarely fails for lack of imagination. It fails because of three quiet mistakes that feel good while you make them.
- The picture replaces the plan. Whoever watches the applause scene every night feels like they are working on the goal. They are not. The fix is step four: routine instead of outcome, before each session, with a time attached.
- The obstacle is outside. Calendar, boss, kids, the conference schedule. Outside obstacles are real, but they are not the lever. Anyone who writes down only those collects excuses with good reasons attached. The inner obstacle is almost always a moment of negotiation with yourself.
- The chart hangs where you never look. A bar in an app you never open, or a poster in a spare room you rarely enter, pulls no one forward. The chart belongs in your path, not in your archive.
All three mistakes share one root. They make visualizing pleasant without making action any easier. In short: good visualization feels less like a dream and more like a dress rehearsal.
Three questions to ask before you visualize your goal again
- Can I see the next step with a time and a place, or only the end?
- Do I know my inner obstacle, and does my if-then sentence sit where the hard moment happens?
- Can I read where I stand in ten seconds, without opening anything?
By the end of October, Priya can answer yes to all three. Ten boxes on the whiteboard are filled, two more than planned. Twice she opened the slide deck at 7 p.m., saw the sticky note and pressed record first. Her first timed run-through came in at 25 minutes with six filler words per minute. She still has to cut three minutes by December 31. She sees that every morning when she sits down at her desk.
To visualize goals is not to think them into existence but to see the path so clearly that the next step becomes easier than the excuse.
Frequently asked questions about goal visualization
Can you give me some examples of visualization skills?
For goals, the core visualization skills are process rehearsal, where you run through the steps of a task in your head, and mental contrasting, where you pair the outcome with your main inner obstacle. Choosing the camera angle, first person for the routine and third person for your identity, is another. On paper, the skill is building a progress display you can read in ten seconds.
What are the 5 C's of goal-setting?
The phrase usually refers to five principles drawn from Edwin Locke and Gary Latham's goal-setting research: clarity, challenge, commitment, feedback and task complexity. Some versions swap in other words, but the core holds. A clear, demanding goal you are committed to works best when you get regular feedback, and a visible progress chart is one simple way to supply it.
What does God say about visualization?
The Bible does not describe visualization as a technique. The verse quoted most often in this context is Habakkuk 2:2, where the prophet is told to write the vision down and make it plain. Read practically, that matches what the research supports: a goal works better when it is written down, specific and visible, not only imagined.
What is the goal of visualization?
The goal of visualization is to turn a distant goal into the next concrete action. Process imagery prepares you for specific situations, mental contrasting turns the gap between wish and reality into energy, and a progress chart shows how far you have come. It is not meant to make the goal happen on its own.
Does the law of attraction work for goals?
There is no evidence that thinking about a goal attracts it. Gabriele Oettingen's studies even show that purely positive fantasies about a goal can lower effort. What works is visualization that changes behavior: rehearsing the routine, naming the obstacle and keeping progress in sight.
How often should you visualize your goals?
Picture the outcome once when you set the goal and then once per quarter. Run through the routine before every key session, which takes one to three minutes. Update your progress chart once a week.
Last updated: 19 October 2026
Read next
 Goal Setting
Intrinsic Motivation: What Drives You From the Inside
Intrinsic motivation is not a personality trait. Meaning, 12 examples, the three needs behind it and five steps to build it, with a worked example.
17 min read
 Goal Setting
Financial Goals: How to Turn Wishes Into a Plan
Financial goals are not wishes with a dollar sign. Short and long term examples, SMART savings goals and a five step plan, worked through one year.
17 min read
 Goal Setting
WOOP Method: Four Steps From Wish to If-Then Plan
The WOOP method is not positive thinking. What WOOP stands for, the research, if-then plans, eight goal examples and a five-minute guide.
18 min read